A) do not minimize the total cost of a given amount of abatement.
B) lead all firms to abate more pollution than the socially optimal amount.
C) lead all firms to abate less pollution than the socially optimal amount.
D) do not achieve the targeted amount of pollution abatement.
E) are controlling quantities of pollution abatement as opposed to prices.
Correct Answer

verified
Correct Answer
verified
Multiple Choice
When an external cost associated with the production of some good has been internalized,it means that
A) the opportunity cost of production is passed on to the consumer.
B) the private cost of production is borne by the producer.
C) the external costs are incorporated into private decision making.
D) the consumer is bearing the net social benefits imposed by the producer.
E) the firm is ignoring social costs.
Correct Answer

verified
Correct Answer
verified
Multiple Choice
The diagram below shows the marginal costs of pollution abatement for two firms,Firm 1 and Firm 2.
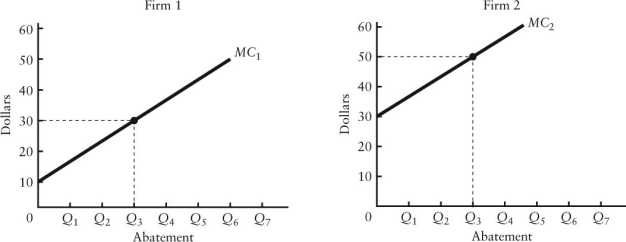 FIGURE 17-5
-Refer to Figure 17-5.Suppose each firm is currently abating pollution to the level Q3.Which of the following statements is true?
A) This outcome is efficient because both firms are abating the same amount.
B) This outcome is not allocatively efficient because the marginal benefits and marginal costs of abatement are not equated.
C) This outcome is not allocatively efficient because less than 100% abatement is being achieved.
D) This outcome is not productively efficient because one firm is abating more pollution than the other.
E) This outcome is not productively efficient because the total cost of achieving this level of abatement is not minimized.
Correct Answer

verified
Correct Answer
verified
Multiple Choice
Zero environmental damage is probably
A) technologically possible and economically efficient.
B) technologically possible but not economically efficient.
C) economically efficient but not technologically possible.
D) neither technologically possible nor economically efficient.
E) necessary if the human race is to survive.
Correct Answer

verified
Correct Answer
verified
Multiple Choice
The diagram below shows the marginal cost of pollution abatement for two firms,Firm X and Firm Y.
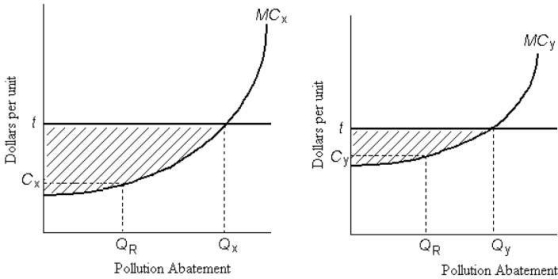 FIGURE 17-6
-Refer to Figure 17-6.There is an emissions tax of $ t per unit of pollution.Which of the following statements regarding the pollution abatement activities by the two firms is correct?
A) It is not socially optimal to have Firm X doing pollution abatement of QX while Firm Y does the lesser amount,QY.
B) It is efficient for Firm Y to do less pollution abatement than Firm X because Firm Y faces higher costs of abatement.
C) The emissions tax causes no change in the firmsʹ polluting activity.
D) The shaded areas in the two graphs depict the social costs of pollution caused by Firms X and Y.
E) The emissions tax causes an optimal level of pollution.
Correct Answer

verified
Correct Answer
verified
Multiple Choice
The banning of wood-burning stoves and fireplaces is an example of
A) safety regulations.
B) emissions taxes.
C) tradable emissions standards.
D) direct pollution controls.
E) a market-based environmental policy.
Correct Answer

verified
Correct Answer
verified
Multiple Choice
A downward-sloping marginal benefit curve for pollution abatement means that
A) the costs of pollution decrease as further amounts are abated.
B) the marginal cost of pollution reduction will always exceed the marginal benefit.
C) it is impossible to know the benefits from additional increments of pollution abatement.
D) society views additional increments of pollution abatement as unnecessary.
E) there are decreasing incremental benefits to be realized from additional increments of pollution abatement.
Correct Answer

verified
Correct Answer
verified
Multiple Choice
The figure below shows the demand and supply curves for pollution abatement.
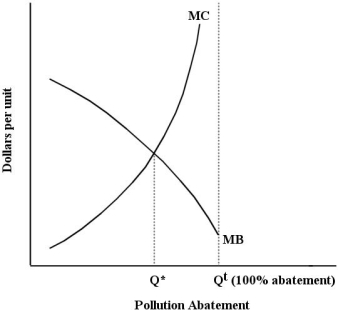 FIGURE 17-3
-Refer to Figure 17-3.The socially optimal amount of pollution is
A) Q* + Qt.
B) Qt - Q*.
C) Q*.
D) Qt.
E) 0.
Correct Answer

verified
Correct Answer
verified
Multiple Choice
What is the ʺmarginal cost of pollution abatementʺ?
A) the private cost of producing one additional unit of pollution
B) the social cost of producing one additional unit of pollution
C) the cost of the last unit of pollution produced
D) the cost of reducing pollution by one additional unit
E) the external cost of pollution abatement
Correct Answer

verified
Correct Answer
verified
Multiple Choice
The diagram below shows the marginal cost of pollution abatement for two firms,Firm X and Firm Y.
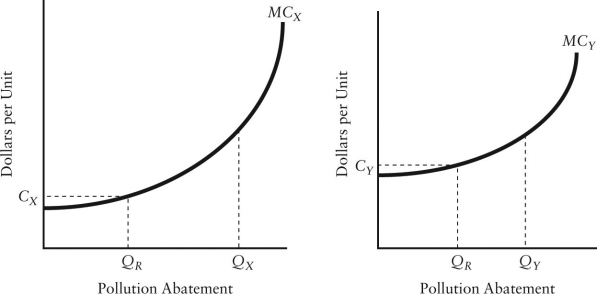 FIGURE 17-4
-Refer to Figure 17-4.Suppose the government requires each firm to reduce pollution by the same amount,QR.The result will be
A) fair and just because both firms are facing the same requirements.
B) economically inefficient because Firm X is not producing as much pollution as Firm Y and therefore should not be faced with the same requirements.
C) economically efficient because even though their marginal costs of abatement differ,the marginal cost for the last unit of abatement is equal.
D) economically inefficient because Firm Y is then abating pollution at a higher marginal cost than Firm X.
E) economically efficient because the maximum amount of pollution will be abated.
Correct Answer

verified
Correct Answer
verified
Multiple Choice
The socially optimal level of output of any good is the quantity where all marginal costs of production,private plus external,equal the
A) marginal cost of production.
B) marginal benefit to society.
C) average benefit to society.
D) total benefit to society.
E) marginal benefit to the firm.
Correct Answer

verified
Correct Answer
verified
Multiple Choice
Suppose a firm producing roof shingles imposes a negative externality on the surrounding area due to the noxious fumes emitted from the plant.The private marginal cost,social marginal cost and marginal benefit associated with the production of the shingles are given by the following equations: MCP = 5 + 2Q MCS = 10 + 3Q MB = 50 - Q A competitive free market will produce ________ units, at a price of ________ per unit
A) 20; $25
B) 20; $40
C) 15; $40
D) 15; $35
E) 10; $35
Correct Answer

verified
Correct Answer
verified
Multiple Choice
Two firms,A and B,are legally required to reduce their toxic emissions.If Firm Aʹs marginal cost of abatement is $5 and Firm Bʹs marginal cost of abatement is $5,
A) their joint total cost of abatement is at a minimum.
B) their joint total cost of abatement is at a maximum.
C) the socially optimal joint level of abatement is not being achieved.
D) Firm A should abate more and Firm B should abate less.
E) Firm B should abate more and Firm A should abate less.
Correct Answer

verified
Correct Answer
verified
Multiple Choice
Between 1995 and 2011,Canadaʹs greenhouse gas emissions ________ by ________%
A) decreased; 6
B) decreased; 1
C) increased; 6
D) increased; close to 50
E) increased; about 25
Correct Answer

verified
Correct Answer
verified
Multiple Choice
The diagram below shows the marginal cost of pollution abatement for two firms,Firm X and Firm Y.
 FIGURE 17-6
-Refer to Figure 17-6.There is an emissions tax of $ t per unit of pollution.The resulting amount of pollution abatement is socially optimal if
A) Firm X abates QX and Firm Y abates QY.
B) each firm abates at QR.
C) the emissions tax causes no change in firmsʹ polluting activity.
D) the emissions tax is equal to the marginal social cost of pollution.
E) each firm pays the maximum amount of tax.
Correct Answer

verified
Correct Answer
verified
Multiple Choice
As a method of pollution control,tradable emissions permits,or ʺcap and trade,ʺ
A) are an example of paternalistic social regulation.
B) allow pollution to continue unabated,but only at a huge price to polluting firms.
C) are more effective than emissions taxes when pollution is hard to measure.
D) have the advantage of decentralized decision making (like emissions taxes) while also setting the maximum permissible level of pollution (like direct controls) .
E) are not a morally acceptable method of pollution control.
Correct Answer

verified
Correct Answer
verified
Multiple Choice
The optimal amount of pollution abatement is such that
A) the total benefit of reducing pollution is equal to the total cost of reducing pollution.
B) the marginal social cost of reducing pollution is just equal to the marginal social benefits from doing so.
C) the marginal private cost of reducing pollution is just equal to the profit of the polluting firms.
D) there is no remaining pollution.
E) none of the above; there is no optimal amount of pollution abatement.
Correct Answer

verified
Correct Answer
verified
Multiple Choice
The diagram below shows a market for tradable pollution permits.
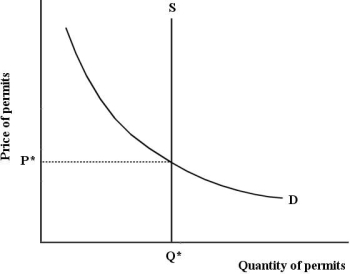 FIGURE 17-8
-Refer to Figure 17-8,which depicts the market for tradable pollution permits.If there is an increase in firmsʹ marginal cost of pollution abatement,
A) firms decide to abate more pollution.
B) the price of pollution permits will fall.
C) firms will demand more pollution permits.
D) firms will demand fewer pollution permits.
E) firms require exactly Q* permits.
Correct Answer

verified
Correct Answer
verified
Multiple Choice
The diagram below shows the marginal cost of abatement for each of two firms,A and B.Each firm is initially abating Q 0 units of pollution.
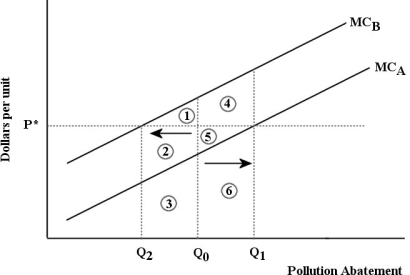 FIGURE 17-7
-Refer to Figure 17-7.Suppose that a system of tradable pollution permits is introduced into this market and the equilibrium permit price is p*.The effect will be that
A) Firm B will sell permits to Firm A,pollute less,and reduce its costs by the area 1; Firm A will buy permits from Firm B,pollute more,and increase its costs by the area 4.
B) Firm B will sell permits to Firm A,pollute more,and reduce its costs by the area 1; Firm A will buy permits from Firm B,pollute less,and increase its earnings by area 4.
C) Firm B will buy permits from Firm A,pollute less,and increase its costs by the areas 2 + 3; Firm A will sell permits to Firm B,pollute more,and reduce its earnings by areas 4 + 5.
D) Firm B will buy permits from Firm A,pollute more,and reduce its costs by the area 1; Firm A will sell permits to Firm B,pollute less,and increase its earnings by area 5.
Correct Answer

verified
Correct Answer
verified
Multiple Choice
The table below shows the marginal benefit and marginal cost of pollution abatement for an economy. 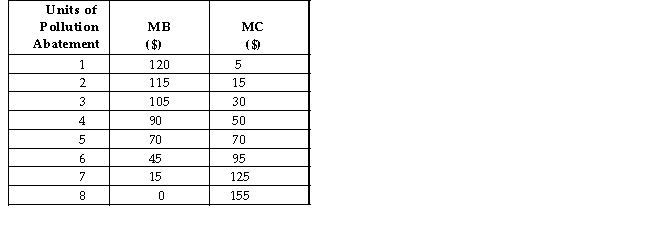 TABLE 17-1
-Refer to Table 17-1.Suppose a public authority has the mandate to maximize social welfare by choosing the appropriate amount of pollution abatement.The total net benefit from the optimal amount of pollution abatement is
A) $0.
B) $120.
C) $155.
D) $275.
E) $330.
Correct Answer

verified
Correct Answer
verified
Showing 81 - 100 of 126
Related Exams