The Coase theorem asserts that, in the presence of externalities,
A) private economic actors sometimes can reach a bargain that produces an efficient outcome.
B) private economic actors always can reach a bargain that makes everyone better off.
C) private solutions cannot be very effective.
D) corrective taxes cannot be very effective.
F) B) and C)
Correct Answer

verified
Correct Answer
verified
Figure 10-9 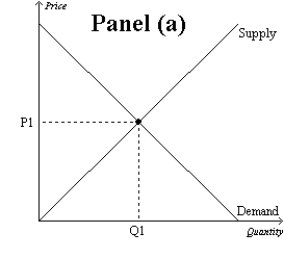
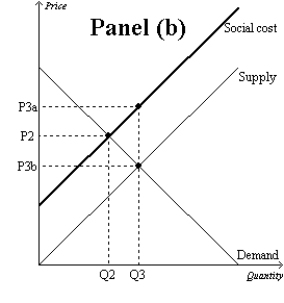
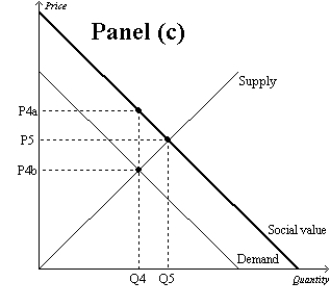 -Refer to Figure 10-9, Panel (b) and Panel (c) . Which of the following is correct?
A) A tax would move the market in Panel (b) and the market in Panel (c) closer to the socially optimal outcome.
B) A subsidy would move the market in Panel (b) and the market in Panel (c) closer to the socially optimal outcome.
C) A tax would move the market in Panel (b) closer to the socially optimal outcome, but a subsidy would move the market in Panel (c) closer to the socially optimal outcome.
D) A subsidy would move the market in Panel (b) closer to the socially optimal outcome, but a tax would move the market in Panel (c) closer to the socially optimal outcome.
F) A) and C)
Correct Answer
verified
Correct Answer
verified