A) the price of that good in the law of demand.
B) consumers' income.
C) consumers' tastes and preferences.
D) the number of potential buyers.
Correct Answer

verified
Correct Answer
verified
Multiple Choice
After the price of music downloads falls, Phil buys fewer CDs and buys a new MP3 player. For Phil,
A) music downloads and CDs are complements, and MP3 players and CDs are substitutes
B) music downloads, MP3 players, and CDs are all complements.
C) music downloads and CDs are substitutes, and music downloads and MP3 players are complements.
D) music downloads, MP3 players, and CDs are all substitutes.
Correct Answer

verified
Correct Answer
verified
Multiple Choice
According to the law of demand, the quantity demanded of a good is related to
A) the average price of all goods.
B) income.
C) any factor that affects the decision of an individual consumer but not the market.
D) the relative price of that good.
Correct Answer

verified
Correct Answer
verified
Multiple Choice
Of the following, which is the least likely to be an example of substitute goods?
A) Beer and pretzels
B) Margarine and butter
C) Beef and chicken
D) Tea and coffee
Correct Answer

verified
Correct Answer
verified
Multiple Choice
A supply curve
A) has an indirect or negative relationship between price and quantity supplied.
B) has a direct or positive relationship between price and quantity supplied.
C) shows the relationship between quantity supplied and income.
D) shows the relationship between complements.
Correct Answer

verified
Correct Answer
verified
Multiple Choice
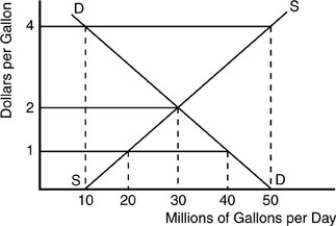
 -According to the above figure for a gasoline market, at a price of $1 per gallon of gasoline, there would be
A) a shortage of 30 million gallons.
B) a surplus of 30 million gallons.
C) a shortage of 20 million gallons.
D) a surplus of 50 million gallons.
Correct Answer

verified
Correct Answer
verified
Multiple Choice
Regarding the law of supply, which of the following statements is correct?
A) As the price of a good or service rises, the quantity supplied will increase.
B) As the price of a good or service rises, the quantity supplied will decrease.
C) The ceteris paribus assumption does not apply.
D) As demand falls, supply rises.
Correct Answer

verified
Correct Answer
verified
Multiple Choice
A demand curve is a graphical representation of
A) consumer tastes.
B) national income.
C) the demand schedule.
D) relative prices.
Correct Answer

verified
Correct Answer
verified
Multiple Choice
If a good is a normal good, an increase in income will
A) decrease the quantity demanded of the good.
B) increase the demand for the good.
C) cause the demand curve for the good to shift to the left.
D) cause a movement down along the demand curve.
Correct Answer

verified
Correct Answer
verified
Multiple Choice
A surplus exists
A) in equilibrium.
B) when quantity supplied is greater than quantity demanded.
C) when quantity supplied is less that quantity demanded.
D) at the market clearing price.
Correct Answer

verified
Correct Answer
verified
Multiple Choice
We are given the individual demand curves for all of the people that consume Good Y. Which statement is true about the market demand curve for Good Y?
A) The market demand curve is obtained by horizontally summing the individual demand curves.
B) The market demand curve is obtained by vertically summing the individual demand curves.
C) The market demand curve cannot be obtained because information on prices is missing.
D) The market demand curve cannot be obtained from individual demand curves.
Correct Answer

verified
Correct Answer
verified
Multiple Choice
The price of an MP3 music player increased from $50 to $70 while the price of a music download increased from $1 to $2. The relative price of an MP3 music player in terms of music downloads
A) increased from 0.04 to 0.05.
B) decreased from 50 to 35.
C) increased, but we need more information to know by how much.
D) decreased, but we need more information to know by how much.
Correct Answer

verified
Correct Answer
verified
Multiple Choice
An excess quantity supplied can be corrected by
A) a fall in price.
B) legally fixing the price at its present level.
C) a decrease in demand.
D) an increase in supply.
Correct Answer

verified
Correct Answer
verified
Multiple Choice
A schedule of how much of a good people will purchase for a range of possible prices during a specified time period, other things constant, is the definition of
A) supply.
B) demand.
C) a purchasing contract.
D) an economic market.
Correct Answer

verified
Correct Answer
verified
Multiple Choice
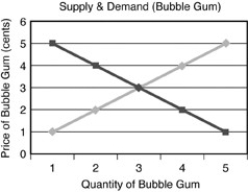
 -Refer to the above figure. At a price of two cents, the quantity of bubble gum demanded will be
A) 3.
B) 2.
C) 4.
D) 5.
Correct Answer

verified
Correct Answer
verified
Multiple Choice
Graphically, the market supply curve is obtained by
A) changing the ceteris paribus conditions.
B) a change in quantity supplied.
C) horizontally summing quantity supplied at various prices for individual producers.
D) vertically summing quantity supplied at various prices for individual producers.
Correct Answer

verified
Correct Answer
verified
Multiple Choice
If the price of airline travel in Europe falls and the demand for train travel in Europe also falls, then the two goods are
A) complements.
B) normal goods.
C) substitutes.
D) inferior goods.
Correct Answer

verified
Correct Answer
verified
Multiple Choice
If the price of butter increases, the demand for margarine
A) will be unchanged.
B) will shift outward.
C) will shift inward.
D) will kink into an S-curve.
Correct Answer

verified
Correct Answer
verified
Multiple Choice
Which of the following is a determinant of consumer demand?
A) Expectation of the future relative price of a product
B) Taxes imposed on firms that sell the product
C) Cost of inputs used to produce the product
D) Number of firms that produce the product
Correct Answer

verified
Correct Answer
verified
Multiple Choice
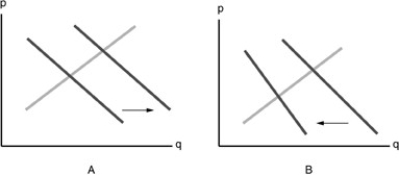
 -Refer to the above figure for the market of Cheerios. Which diagram depicts the effect of an increase in the price of Cheerios?
A) A
B) B
C) neither graph
D) both graphs
Correct Answer

verified
Correct Answer
verified
Showing 301 - 320 of 448
Related Exams