A) rises, and the price received by sellers rises.
B) rises, and the price received by sellers falls.
C) falls, and the price received by sellers rises.
D) falls, and the price received by sellers falls.
Correct Answer

verified
Correct Answer
verified
Multiple Choice
Figure 8-8
Suppose the government imposes a $10 per unit tax on a good. 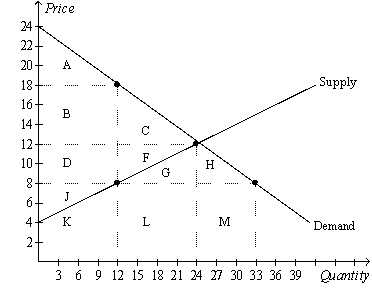 -Refer to Figure 8-8. The deadweight loss of the tax is the area
A) B+D.
B) C+F.
C) A+C+F+J.
D) B+C+D+F.
Correct Answer

verified
Correct Answer
verified
Multiple Choice
According to Arthur Laffer, the graph that represents the amount of tax revenue (measured on the vertical axis) as a function of the size of the tax (measured on the horizontal axis) looks like
A) a U.
B) an upside-down U.
C) a horizontal straight line.
D) an upward-sloping line or curve.
Correct Answer

verified
Correct Answer
verified
Multiple Choice
Other things equal, the deadweight loss of a tax
A) decreases as the size of the tax increases.
B) increases as the size of the tax increases, but the increase in the deadweight loss is less rapid than the increase in the size of the tax.
C) increases as the size of the tax increases, and the increase in the deadweight loss is more rapid than the increase in the size of the tax.
D) increases as the price elasticities of demand and/or supply increase, but the deadweight loss does not change as the size of the tax increases.
Correct Answer

verified
Correct Answer
verified
Multiple Choice
Figure 8-10 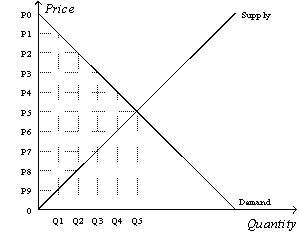 -Refer to Figure 8-10. Suppose the government imposes a tax that reduces the quantity sold in the market after the tax to Q2. With the tax, the consumer surplus is
A) (P0-P2) x Q2.
B) x (P0-P2) x Q2.
C) (P0-P5) x Q5.
D) x (P0-P5) x Q5.
Correct Answer

verified
Correct Answer
verified
Multiple Choice
Figure 8-2
The vertical distance between points A and B represents a tax in the market. 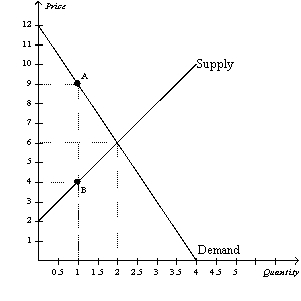 -Refer to Figure 8-2. Total surplus without the tax is
A) $10, and total surplus with the tax is $2.50.
B) $10, and total surplus with the tax is $7.50.
C) $20, and total surplus with the tax is $2.50.
D) $20, and total surplus with the tax is $7.50.
Correct Answer

verified
Correct Answer
verified
Multiple Choice
Figure 8-6
The vertical distance between points A and B represents a tax in the market. 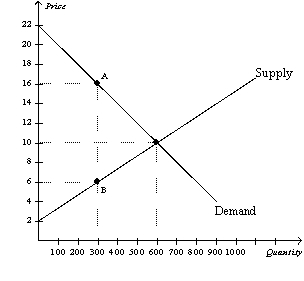 -Refer to Figure 8-6. What happens to producer surplus when the tax is imposed in this market?
A) Producer surplus falls by $600.
B) Producer surplus falls by $900.
C) Producer surplus falls by $1,800.
D) Producer surplus falls by $2,100.
Correct Answer

verified
Correct Answer
verified
Multiple Choice
Figure 8-5
Suppose that the government imposes a tax of P3 - P1. 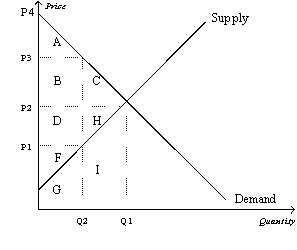 -Refer to Figure 8-5. Producer surplus before the tax was levied is represented by area
A) A.
B) A+B+C.
C) D+H+F.
D) F.
Correct Answer

verified
Correct Answer
verified
Multiple Choice
A tax placed on buyers of airline tickets shifts the
A) demand curve for airline tickets downward, decreasing the price received by sellers of airline tickets and causing the quantity of airline tickets to increase.
B) demand curve for airline tickets downward, decreasing the price received by sellers of airline tickets and causing the quantity of airline tickets to decrease.
C) supply curve for airline tickets upward, decreasing the effective price paid by buyers of airline tickets and causing the quantity of airline tickets to increase.
D) supply curve for airline tickets upward, increasing the effective price paid by buyers of airline tickets and causing the quantity of airline tickets to decrease.
Correct Answer

verified
Correct Answer
verified
Multiple Choice
Figure 8-19. The figure represents the relationship between the size of a tax and the tax revenue raised by that tax. 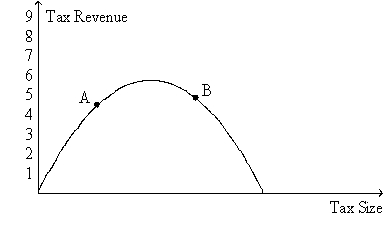 -Refer to Figure 8-19. The curve that is shown on the figure is called the
A) deadweight-loss curve.
B) tax-incidence curve.
C) Laffer curve.
D) Lorenz curve.
Correct Answer

verified
Correct Answer
verified
Multiple Choice
Scenario 8-1 Erin would be willing to pay as much as $100 per week to have her house cleaned. Ernesto's opportunity cost of cleaning Erin's house is $70 per week. -Refer to Scenario 8-1. If Erin pays Ernesto $80 to clean her house, Erin's consumer surplus is
A) $80.
B) $30.
C) $20.
D) $10.
Correct Answer

verified
Correct Answer
verified
Multiple Choice
Suppose Ashley needs a dog sitter so that she can travel to her sister's wedding. Ashley values dog sitting for the weekend at $200. Cami is willing to dog sit for Ashley so long as she receives at least $150. Ashley and Cami agree on a price of $175. Suppose the government imposes a tax of $10 on dog sitting. The tax has made Ashley and Cami worse off by a total of
A) $50.
B) $40.
C) $20.
D) $10.
Correct Answer

verified
Correct Answer
verified
Multiple Choice
Figure 8-4
The vertical distance between points A and B represents a tax in the market. 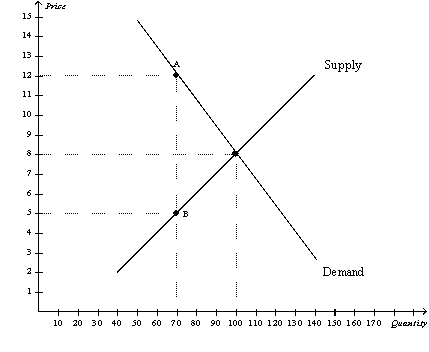 -Refer to Figure 8-4. The price that buyers effectively pay after the tax is imposed is
A) $12.
B) between $8 and $12.
C) between $5 and $8.
D) $5.
Correct Answer

verified
Correct Answer
verified
Multiple Choice
Figure 8-14 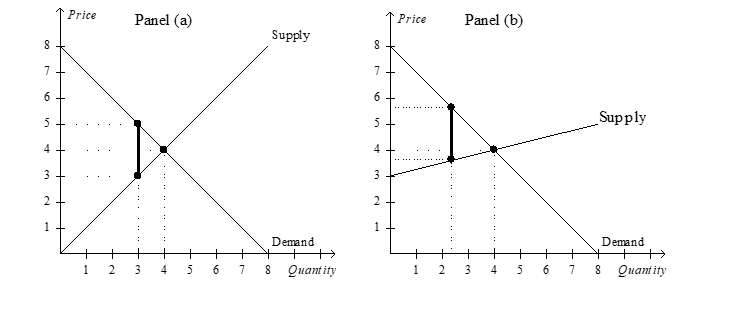 -Refer to Figure 8-14. Panel (a) and Panel (b) each illustrate a $2 tax placed on a market. In comparison to Panel (a) , Panel (b) illustrates which of the following statements?
A) When demand is relatively inelastic, the deadweight loss of a tax is smaller than when demand is relatively elastic.
B) When demand is relatively elastic, the deadweight loss of a tax is larger than when demand is relatively inelastic.
C) When supply is relatively inelastic, the deadweight loss of a tax is smaller than when supply is relatively elastic.
D) When supply is relatively elastic, the deadweight loss of a tax is larger than when supply is relatively inelastic.
Correct Answer

verified
Correct Answer
verified
Multiple Choice
A decrease in the size of a tax is most likely to increase tax revenue in a market with
A) elastic demand and elastic supply.
B) elastic demand and inelastic supply.
C) inelastic demand and elastic supply.
D) inelastic demand and inelastic supply.
Correct Answer

verified
Correct Answer
verified
Multiple Choice
Taxes on labor encourage which of the following?
A) labor demand to be more inelastic
B) mothers to stay at home rather than work in the labor force
C) workers to work overtime
D) fathers to take on second jobs
Correct Answer

verified
Correct Answer
verified
Multiple Choice
Figure 8-6
The vertical distance between points A and B represents a tax in the market.  -Refer to Figure 8-6. When the tax is placed on this good, the quantity sold
A) is 600, and buyers effectively pay $10.
B) is 300, and buyers effectively pay $10.
C) is 600, and buyers effectively pay $16.
D) is 300, and buyers effectively pay $16.
Correct Answer

verified
Correct Answer
verified
Multiple Choice
When a tax is placed on the buyers of a product, a result is that buyers effectively pay
A) less than before the tax, and sellers effectively receive less than before the tax.
B) less than before the tax, and sellers effectively receive more than before the tax.
C) more than before the tax, and sellers effectively receive less than before the tax.
D) more than before the tax, and sellers effectively receive more than before the tax.
Correct Answer

verified
Correct Answer
verified
True/False
The demand for beer is more elastic than the demand for milk, so a tax on beer would have a smaller deadweight loss than an equivalent tax on milk, all else equal.
Correct Answer

verified
Correct Answer
verified
Multiple Choice
Figure 8-6
The vertical distance between points A and B represents a tax in the market.  -Refer to Figure 8-6. Without a tax, producer surplus in this market is
A) $1,500.
B) $2,400.
C) $3,000.
D) $3,600.
Correct Answer

verified
Correct Answer
verified
Showing 261 - 280 of 422
Related Exams