A) The economy is producing on the production possibilities curve.
B) The economy is producing outside the production possibilities curve.
C) The economy is getting the fewest goods and services from the available resources.
D) Everyone in the economy is happy.
Correct Answer

verified
Correct Answer
verified
Multiple Choice
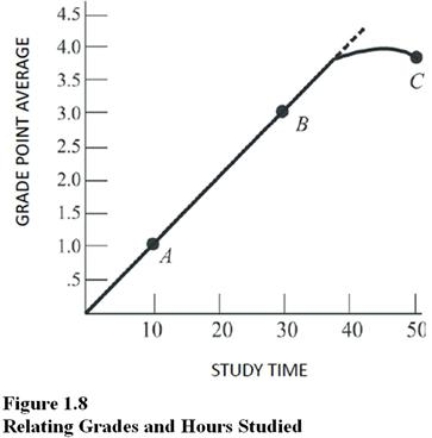
 Refer to Figure 1.8.If the university decides to lower grading standards, then
A) This curve will shift rightward.
B) This curve will pivot up and to the left.
C) The curve will begin to bend downward at an earlier point.
D) We will slide up the curve from point B to point C.
Correct Answer

verified
Correct Answer
verified
Multiple Choice
If an economy experiences increasing opportunity costs with respect to two goods, then the production possibilities curve between the two goods will be
A) Bowed outward or concave from below.
B) A straight, downward-sloping line.
C) Bowed inward or convex from below.
D) Bowed outward until the two goods are equal, and then bowed inward.
Correct Answer

verified
Correct Answer
verified
Multiple Choice
Which economist argued that free markets unleashed the "animal spirits" of entrepreneurs, propelling innovation, technology, and growth?
A) Lord Kelvin.
B) Kenneth Olsen.
C) Irving Fisher.
D) John Maynard Keynes.
Correct Answer

verified
Correct Answer
verified
Multiple Choice
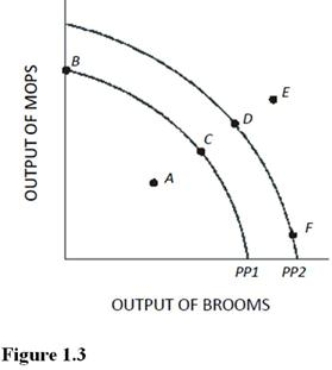
 Which of the following is true about the combination of mops and brooms represented by point E in Figure 1.3 and using PP1?
A) Point E is efficient now.
B) Point E is attainable if this economy uses more of its available resources.
C) Point E is unattainable if this economy becomes more efficient.
D) Point E is attainable only if more resources become available or technological advances are made. Any point outside the production possibilities curve cannot be attained without growth in resources or better technology.
Correct Answer

verified
Correct Answer
verified
Multiple Choice
When the invisible hand does not produce optimal outcomes for the economy, there is evidence of
A) Market failure.
B) Government failure.
C) Macroeconomic failure.
D) Scarcity.
Correct Answer

verified
Correct Answer
verified
Multiple Choice
According to the law of increasing opportunity costs,
A) The more one is willing to pay for resources, the smaller will be the possible level of production.
B) Increasing the production of a particular good will cause the price of the good to remain constant.
C) In order to produce additional units of a particular good, it is necessary for society to sacrifice increasingly larger amounts of alternative goods.
D) None of the choices are correct.
Correct Answer

verified
Correct Answer
verified
Multiple Choice
Table 1.2 shows the hypothetical trade-off between different combinations of Stealth bombers and B-1 bombers that might be produced in a year with the limited U.S.capacity, ceteris paribus.Complete the table by calculating the required opportunity costs for both the B-1 and Stealth bombers. Table 1.2 Production Possibilities for Bombers The lowest opportunity cost anywhere in Table 1.2 for Stealth Bombers is
A) .4 B
B) .3 B
C) .2 B
D) .10 B
Correct Answer

verified
Correct Answer
verified
Multiple Choice
Producing at a point inside the production possibilities curve
A) Means society must be using its resources efficiently.
B) Is unattainable given the present level of technology.
C) Is feasible when the nation is at war but not feasible when the nation is at peace.
D) Suggests we are forgoing the ability to produce more of both goods. This is known as an inefficient point of production.
Correct Answer

verified
Correct Answer
verified
Multiple Choice
Table 1.3 shows the hypothetical trade-off between different combinations of brushes and combs that might be produced in a year with the limited capacity for Country X, ceteris paribus.Complete the table by calculating the required opportunity costs for brushes and combs. Table Production Possibilities for Brushes and Combs On the basis of your calculations in Table 1.3, the lowest opportunity cost for combs in terms of brushes is
A) 10 brushes per comb.
B) 2 brushes per comb.
C) 0.33 brush per comb.
D) 8.5 brushes per comb.
Correct Answer

verified
Correct Answer
verified
Multiple Choice
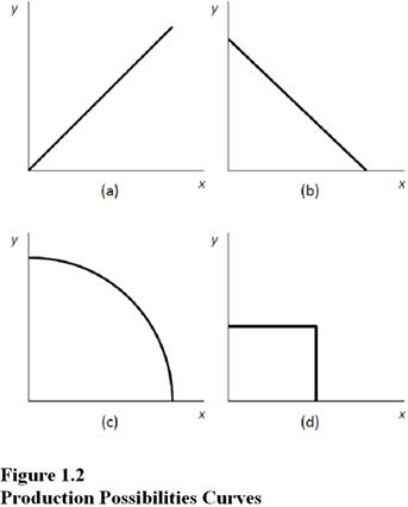
 Choose the letter of the curve in Figure 1.2 that best represents a production possibilities curve for two goods for which there are constant opportunity costs:
A) A
B) B.
C) C.
D) D.
Correct Answer

verified
Correct Answer
verified
Multiple Choice
The production possibilities curve illustrates which two of the following essential principles?
A) Factors of production and price signals.
B) Scarce resources and opportunity cost.
C) Market mechanisms and laissez faire.
D) Economic growth and market failure.
Correct Answer

verified
Correct Answer
verified
Multiple Choice
Table 1.3 shows the hypothetical trade-off between different combinations of brushes and combs that might be produced in a year with the limited capacity for Country X, ceteris paribus.Complete the table by calculating the required opportunity costs for brushes and combs. Table Production Possibilities for Brushes and Combs On the basis of your calculations in Table 1.3, what is the opportunity cost of producing at point M rather than point N?
A) 23 combs.
B) 21 combs.
C) 1 brush.
D) 2 brushes.
Correct Answer

verified
Correct Answer
verified
Multiple Choice
Table 1.1 shows the hypothetical trade-off between different combinations of Stealth bombers and B-1 bombers that might be produced in a year with the limited U.S.capacity, ceteris paribus.Complete the table by calculating the required opportunity costs for both the B-1 and Stealth bombers. Table 1.1 Production Possibilities for Bombers The lowest opportunity cost anywhere in Table 1.1 for B-1 bombers in terms of Stealth bombers is
A) 0 Stealth bombers per B
B) 2 Stealth bombers per B
C) 1 Stealth bomber per B
D) 0.5 Stealth bomber per B
Correct Answer

verified
Correct Answer
verified
Multiple Choice
In terms of the production possibilities curve, inefficiency is represented by
A) All points on the curve.
B) All points outside the curve.
C) All points inside the curve.
D) A rightward shift of the curve.
Correct Answer

verified
Correct Answer
verified
Multiple Choice
Table 1.1 shows the hypothetical trade-off between different combinations of Stealth bombers and B-1 bombers that might be produced in a year with the limited U.S.capacity, ceteris paribus.Complete the table by calculating the required opportunity costs for both the B-1 and Stealth bombers. Table 1.1 Production Possibilities for Bombers In the production range of 7 to 9 Stealth bombers, the opportunity cost of producing 1 more Stealth bomber in terms of B-1s is
A) 0.
B) 3.
C) 0.5.
D) 2.
Correct Answer

verified
Correct Answer
verified
Multiple Choice
A consequence of the economic problem of scarcity is that
A) Choices have to be made about how resources are used.
B) There is never too much of any good or service produced.
C) The production of goods and services must be controlled by the government.
D) The production possibilities curve is bowed outward.
Correct Answer

verified
Correct Answer
verified
Multiple Choice
A technological advance would best be represented by
A) A shift outward of the production possibilities curve.
B) A shift inward of the production possibilities curve.
C) A movement from inside the production possibilities curve to a point on the production possibilities curve.
D) A movement from the production possibilities curve to a point inside the production possibilities curve. The shift would move the production possibilities curve away from the origin so that we can get more of both goods.
Correct Answer

verified
Correct Answer
verified
True/False
Opportunity cost is a theoretical concept with no practical application.
Correct Answer

verified
Correct Answer
verified
Multiple Choice
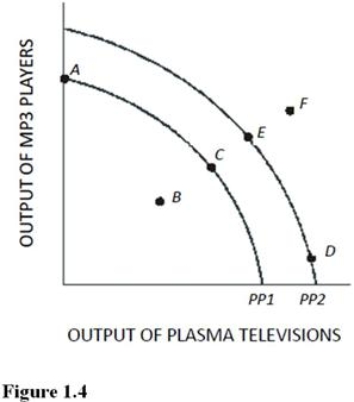
 Which of the following is true about the combination of plasma televisions and MP3 players represented by point F in Figure 1.4?
A) Point F is inefficient now.
B) Point F is unattainable even with advances in technology.
C) Point F will be more easily attainable if the government takes control of all privately run factories.
D) Point F can possibly be reached if more economic resources become available or technology improves. This point is not possible with the current endowment of resources and technology.
Correct Answer

verified
Correct Answer
verified
Showing 81 - 100 of 151
Related Exams